Highlights of the 2020 Medicare ACO Program Results
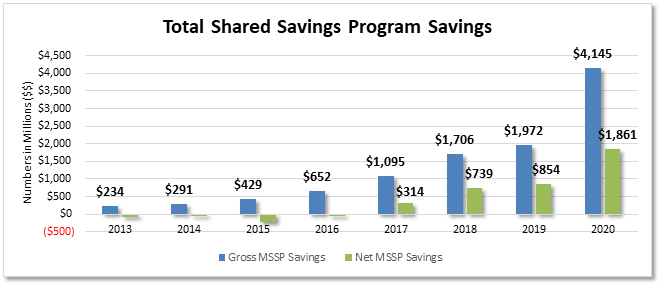
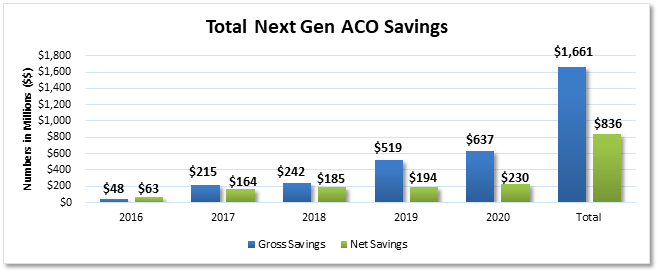
Medicare accountable care organizations (ACOs) continued their trend of increasing savings each year in 2020, generating $4.8 billion in gross savings and $2.1 billion after accounting for shared savings payments, shared loss payments, and discounts to CMS (the Centers for Medicare & Medicaid Services). These include figures from the Medicare Shared Savings Program (MSSP), Medicare’s largest value-based care program, and the Next Generation (Next Gen) ACO Model, the Center for Medicare & Medicaid Innovation Center (Innovation Center) program comprising some of the leading ACOs in the country.
$
TOTAL ACO SAVINGS
Since 2012, ACOs have saved Medicare $13.3 billion in gross savings and $4.7 billion in net savings.
As shown in Graphic 1 below, 2020 was the best year ever for the MSSP, serving 10.6 million patients in 2020.
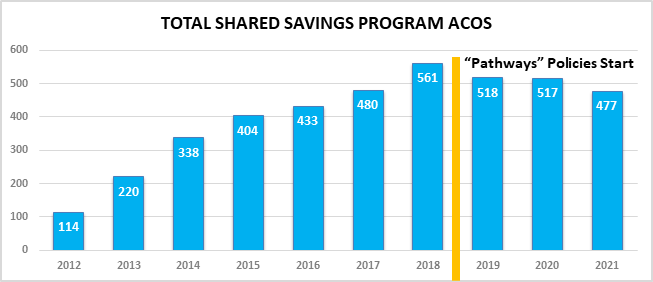
When including savings from the Next Gen Model, along with a now expired Pioneer ACO Model, ACOs have saved Medicare $13.3 billion in gross savings and $4.7 in net savings. Importantly, data show these ACOs continued to provide high-quality care and yield satisfied patients. In 2020, 513 ACOs participated in the MSSP, which is a voluntary model. Today, ACOs care for nearly 20 percent of all Medicare patients and nearly a third of traditional Medicare patients. This document includes highlights of ACO results in 2020.
Key Findings from the 2020 MSSP ACO Results
Key terms
Gross Savings: The difference between ACOs’ benchmark, or CMS-set financial targets, and actual spending.
Net Savings: Money returned to CMS after accounting for shared savings payments, shared loss payments, and discounts.
Graphic 1: Total gross and net savings generated to Medicare from the Shared Savings Program
Leading Innovation Center ACO program banks another record-setting year
Graphic 2: Total gross and net savings generated to Medicare from the Next Generation ACO Model
ACOs get better with time
ACOs get better with time
How Do ACOs Use Shared Savings?
ACOs must tell CMS how they plan to use their shared savings. CMS analyzed the distributions of ACOs who generated shared savings from 2013 to 2017 and shared the top ways ACOs use savings:
Source: CMS’ May 31, 2019 ACO Spotlight
Table 1: The percent of ACOs that earned shared savings by their start year
|
Start Year |
Number of ACOs |
PY 2013 |
PY 2014 |
PY 2015 |
PY 2016 |
PY 2017 |
PY 2018 |
PY 2019 |
PY 2020 |
|
2012 |
39 |
28% |
35% |
42% |
42% |
49% |
57% |
78% |
85% |
|
2013 |
32 |
19% |
25% |
37% |
36% |
42% |
61% |
84% |
72% |
|
2014 |
52 |
N/A |
18% |
21% |
36% |
43% |
47% |
61% |
83% |
|
2015 |
59 |
N/A |
N/A |
21% |
26% |
28% |
23% |
35% |
58% |
|
2016 |
47 |
N/A |
N/A |
N/A |
18% |
28% |
42% |
57% |
66% |
|
2017 |
58 |
N/A |
N/A |
N/A |
N/A |
21% |
33% |
56% |
83% |
|
2018 |
108 |
N/A |
N/A |
N/A |
N/A |
N/A |
21% |
36% |
52% |
|
2019 |
65 |
N/A |
N/A |
N/A |
N/A |
N/A |
N/A |
41% |
63% |
|
2020 |
53 |
N/A |
N/A |
N/A |
N/A |
N/A |
N/A |
N/A |
68% |
Graphic 3: The percent of ACOs that generated savings and earned shared savings

Quality continues to improve
ACOs are saving money for Medicare regardless of various ACO distinctions
As shown in the table above, ACOs save more money, both for Medicare and themselves, the longer they participate in a total cost of care ACO model. The focus on whole-person care,
managing cost, and quality for the full year and developing population health infrastructure drives this continued success. While time in the program is one way to examine ACOs, there are other ACO distinctions and characteristics to consider. Despite the ability to cut the performance data by many different ACO categorizations our analysis of the data showed:
Table 2: NAACOS-member ACOs outperformed non-NAACOS members
|
|
Number of ACOs |
Beneficiaries Served |
Average Savings Per Beneficiary |
Net Savings to Medicare |
Average Quality Score |
|
NAACOS Members |
329 |
7,301,209 |
$422.08 |
$1,239,759,144 |
97.83 |
|
Non-Members |
184 |
3,313,380 |
$398.16 |
$621,455,981 |
97.83 |
|
Total |
513 |
10,614,589 |
$413.50 |
$1,861,215,125 |
97.83 |
Conclusion
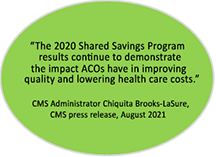
Data from 2020 show ACOs continue to save Medicare money and improve quality and outcomes in the process. As the CMS administrator said, there should be no doubt that ACOs are succeeding. Despite the need to expand upon MSSP’s success, the number of ACOs in 2021 fell to its lowest total since 2017, the year before CMS enacted its Pathways to Success polices.
NAACOS continues to express concern at this decline in ACO participation and offered several recommendations in a letter to the CMS administrator on ways to reverse that decline. NAACOS continues to advocate for passage of the Value in Health Care Act, which would both incentivize ACO participation and create more equitable policies for existing ACOs. Additionally, NAACOS continues to advocate that CMS develop a new full-risk option for ACOs under the Medicare Shared Savings Program (MSSP). This “Enhanced Plus” option would advance ACO participation by creating a full risk and capitation option within MSSP, which to date has only been available in Innovation Center ACO models. Policymakers should look for opportunities to grow ACO participation so that benefits of the program can spread to more patients, while helping solve Medicare’s looming insolvency issues.
